Chapter 22. Knowledge Graphs
The future is already here — it’s just not evenly distributed.
— William Gibson, on NPR’s Talk of the Nation, 1999
The name
The state Part II derived is in production at scale, under an industry name. A knowledge graph is instance data and the ontologies that describe it, stored and queried as one graph. The name went mainstream in May 2012, when Google introduced its Knowledge Graph, “things, not strings.” Google had bought Freebase, a collaboratively edited database of entities, in 2010, and Freebase’s data became the Knowledge Graph’s starting content. Chapter 24 shows Freebase browsed live in 2008. Google has never published what its graph runs on, but the contents are expressible as triples, and its public API serves them that way. Knowledge graphs are also built on other graph models; this chapter’s examples are RDF.
The first movers
Organizations were building knowledge graphs before the term went mainstream, and the first movers documented why: a private thesaurus turned into public identifiers, faster publishing at scale, an order of magnitude less code, integration without bespoke pipelines.
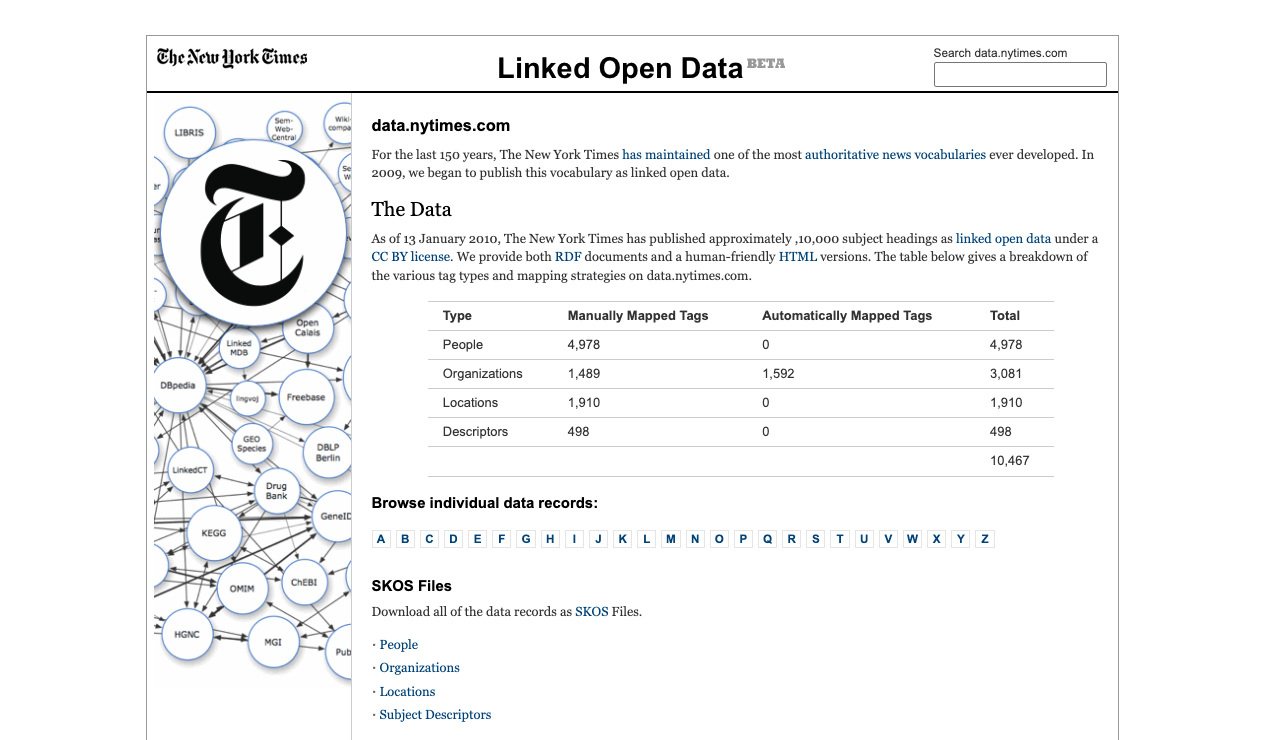
In the world, dated 2009. The New York Times had tagged its archive for nearly a century against a thesaurus of “more than a million terms organized into five controlled vocabularies”. “Unfortunately, our list of subject headings is an island,” its architects wrote. So they gave the first five thousand HTTP URIs and RDF representations under a Creative Commons license, each one mapped by hand to its match in DBpedia (Wikipedia’s data as a graph) and Freebase. Today data.nytimes.com no longer resolves.
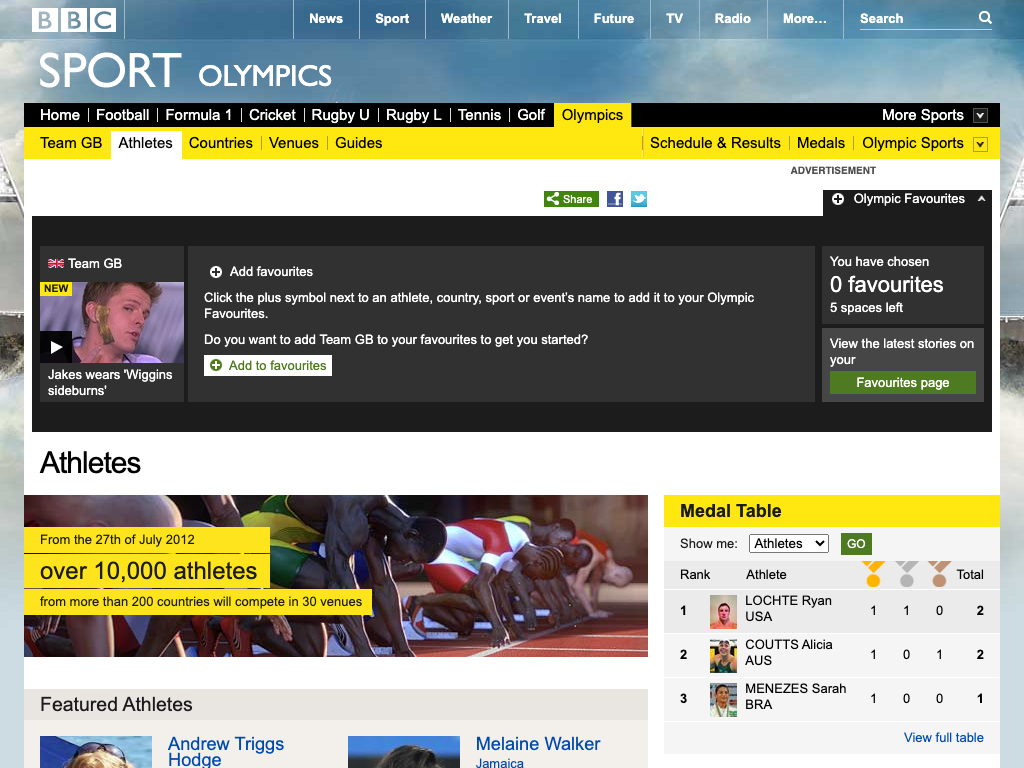
In the world, dated 2010. For the World Cup the BBC generated 700-plus pages from an RDF triple store, more index pages than the rest of BBC Sport combined. By London 2012 the same architecture kept a page for every athlete, team and discipline, ten thousand of them, a scale its architect called “simply impossible to manage using a static CMS driven publishing stack.”
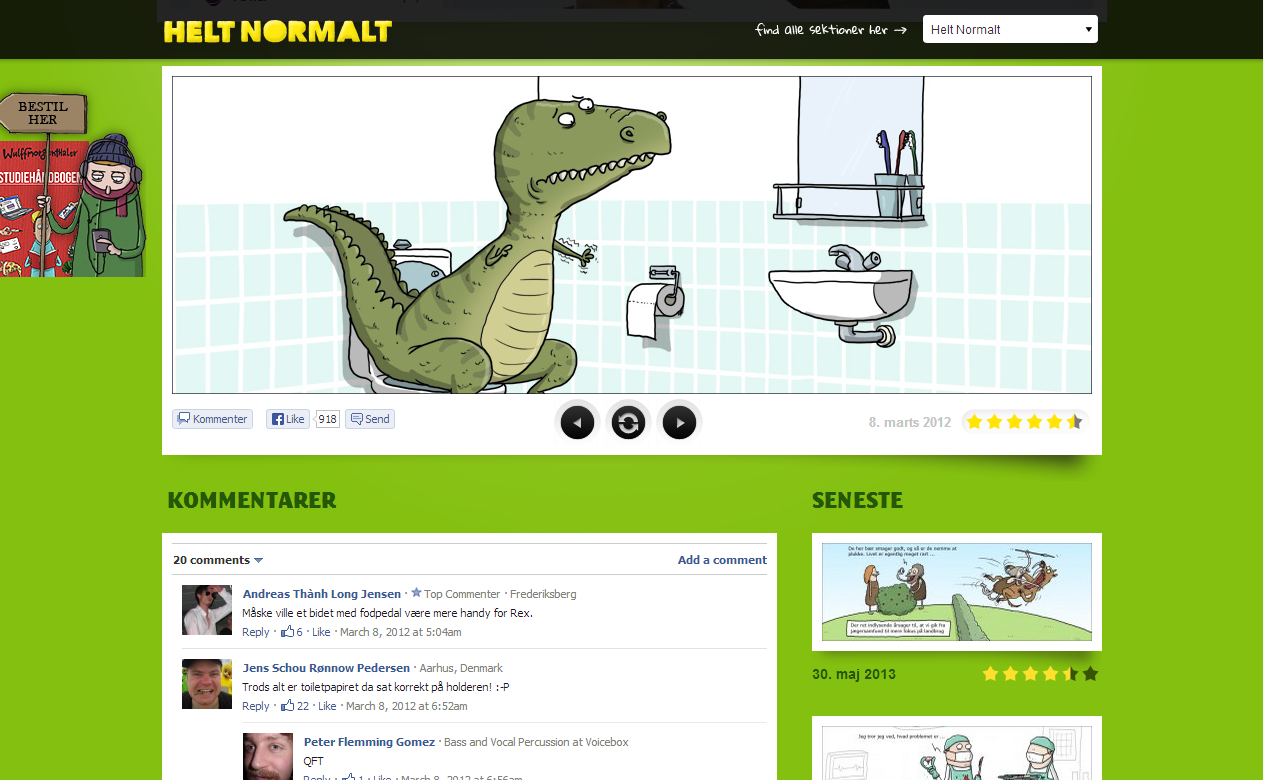
In the world, dated 2011. The Danish comics site Helt Normalt rebuilt its publishing on RDF, SPARQL and XSLT. Its builders told a W3C workshop that the codebase shrank by an order of magnitude against the relational system it replaced. Its ontologies were reused rather than written: even the daily horoscope strip ran on a zodiac vocabulary found on the open web. The platform was Graphity, LinkedDataHub’s predecessor (disclosure: the author’s, per Chapter 19).
In the world, dated 2013. NXP Semiconductors described its product data as “scattered and duplicated across numerous applications and databases,” and published the fix: every product got an HTTP URI, every source was converted to RDF, and SPARQL ran underneath. “The Linked Data is the API.” NXP’s pages were served by the same Graphity.
The wave
The wave behind the first movers came a decade later, at the top of the market. NASA runs the systems engineering of its Moon program on an RDF graph. Siemens holds 1.2 million products in one. The banks maintain FIBO, a shared financial ontology, in OWL, the W3C’s ontology language. Gartner dated the wave in 2021: “by 2025, graph technologies will be used in 80% of data and analytics innovations, up from 10% in 2021”, a figure spanning every graph model, not RDF alone. And AI accelerated the wave. Answering business questions over an enterprise database, an LLM got 17 of 100 right when queried over raw SQL, and 54 over the same data as an RDF graph. Chapter 23 derives what the graph does underneath the LLM.
The words went mainstream too. Palantir has sold its platform’s core abstraction as the Ontology since 2018 and put the word in its SEC filing in 2020. Microsoft followed: Power BI’s datasets became semantic models in 2023, and Fabric now ships an ontology of its own, “a shared, machine-understandable vocabulary of your business.” Neither ontology runs on RDF. The point is small but real: ontology was an academic word the industry avoided, and now it is a product name.
The annotated web
Schema.org is a shared vocabulary that any site can use to describe its own pages, and the ordinary web uses it (Chapter 18). The markup rides in the page. RDFa puts the triples in HTML attributes, so the document a person reads carries the statements a machine reads, with no second copy and no second endpoint. Microdata does the same in attributes of its own. JSON-LD, now the common choice, sets a block of data beside the markup instead of inside it. The October 2024 Common Crawl (the open archive of web crawls) found structured data on 16.5 million of the 37.4 million domains it covered, 74 billion statements in all. Schema.org’s own count is higher, over 45 million domains. Nobody assembles any of it into one store. Each site describes itself for one consumer, the search engines, and stops there.
The open giants
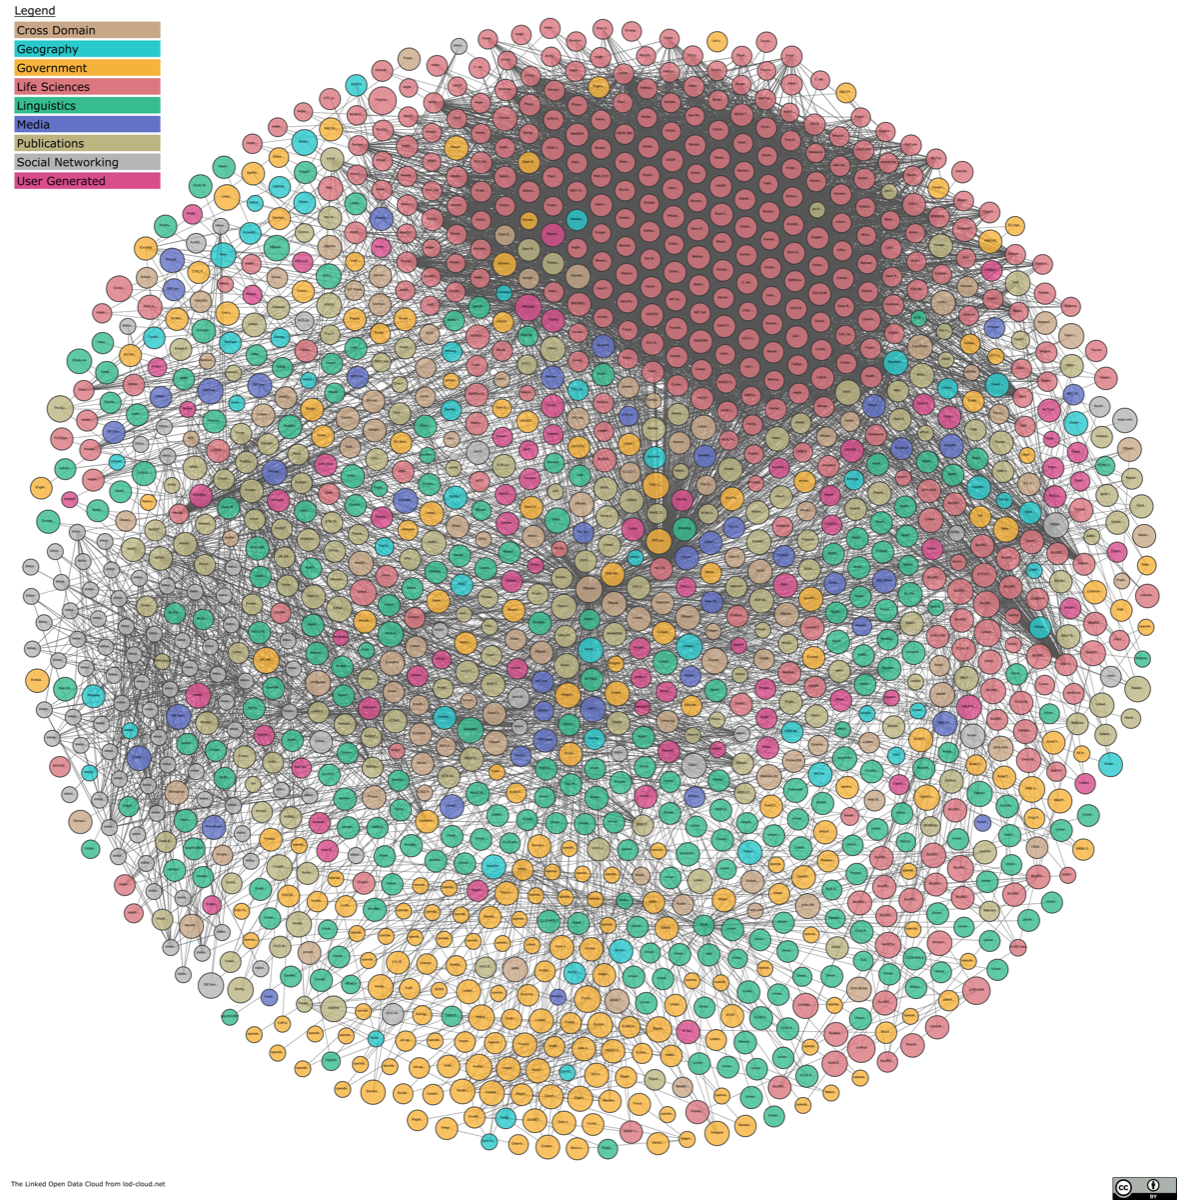
The largest knowledge graphs are not corporate. UniProt, the protein knowledge base, has published its data as RDF since 2008 and holds 232 billion triples behind a public SPARQL endpoint, the largest knowledge graph anyone can query. Wikidata serves about eighteen billion more; it inherited part of Freebase’s data when Google closed it. Google last counted its own graph in 2020: 500 billion facts that nobody outside Google can query. And the open graphs link to one another: the Linked Open Data cloud maps 1,360 interlinked datasets as of June 2026.
The head and the tail
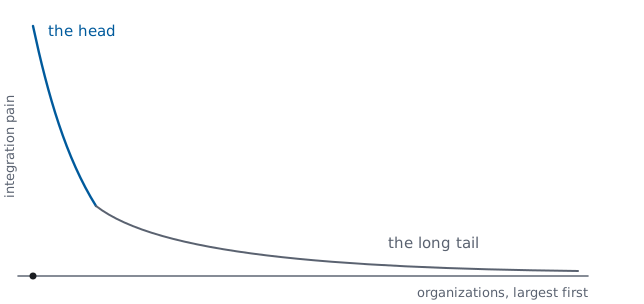
The wave has reached the largest enterprises but few smaller ones, and the reason is arithmetic. Integration pain scales with organization size: General Electric ran about seventy-five procurement systems, Merck about four thousand Oracle databases. Chapter 18 counted the bridges between silos at N × M, and every acquisition raises the count. Adoption follows organization size: smaller organizations run only a handful of data silos, so integration stays manageable by hand and a knowledge graph never becomes necessary.
The unclaimed half
Many have realized RDF’s potential for data integration. Very few have realized its potential for web application architecture. The audit says the same in its own columns: the industry adopted the R-rows and left the S-rows unclaimed. A knowledge graph is Chapter 5’s state without Chapter 4’s architecture. The two chapters that follow are about the other half.